Updated: April 29, 2010
Welcome to the sixth article in the long series on Kernel crash collection and analysis. We have started the series with LKCD, an older utility, followed by a very long review of Kdump, both of which are available as PDF guides, free for download. Next, we learned about new features and changes in the Kdump setup and functionality on openSUSE 11.2 and CentOS 5.4. Now, it's time to start processing the collected memory cores.
Today, we will do just that. Learn how to use the crash utility to open the dumped memory cores, collected at the time of kernel crashes, and read the information contained therein. Please note that this article focuses mainly on being able to use and process the crash dumps. We will focus on the crash analysis more deeply in the next tutorial.

Pre-Introduction
Like the previous five installments, the article is mainly intended for power users and system administrators, but if you wish to enrich your Linux knowledge, you're more than welcome to use the tutorial. Some of the steps will require in-depth familiarity with the functionality of the Linux operating system, which will not be reviewed here.
We will also briefly mention the older lcrash utility, which you may want to run against memory cores collected using LKCD. However, since the two are somewhat obsolete, we will not focus too much on their use.
For more details about lcrash and gdb-kdump, please take a look at the Appendix.
So let's begin!
Table of Contents
- Necessary reading
- Crash setup
- Invoke crash
- Running crash
- Possible errors
- Crash analysis proper
- Official documentation
- References
- Conclusion
- Appendix
- Other tools
- Download
Necessary reading
You MUST read the other articles in other to fully understand how crash works. You can find the detailed list of references below.
Crash setup
Let's begin with the setup.
Prerequisites
You must have Kdump setup properly and working. Please read the three related articles on the subject, including the original guide, as well as two appendix articles that list specific changes and features for openSUSE and CentOS.

crash installation
crash can be found in the repositories of all major distros. The installation is fairly simply and straightforward. You can use either yum, zypper or apt to obtain the package very easily.

Crash location
The default crash directory is /var/crash. You can change the path to anything you want, provided there's enough space on the target device. In general, you should choose a disk or a partition that is equal or exceeds the size of your physical memory.
You can change this path either using GUI tools or manually editing the Kdump configuration file:
- /etc/sysconfig/kdump on openSUSE.
- /etc/kdump.conf on CentOS (RedHat).
openSUSE Kdump configuration using YaST-Kdump module:

CentOS Kdump configuration using system-config-kdump utility:

Memory cores
Memory cores are called vmcore and you will find them in dated directories inside the crash directory. On older versions of Kdump, the directories would only contain the vmcore file.
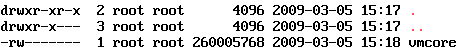
Newer versions also copy the kernel and System map file into the directory, making the core processing easier.


Invoke crash
The crash utility can be invoked in several ways. First, there is some difference between older and newer versions of Kdump, in terms of what they can do and how they process the memory cores. Second, the crash utility can be run manually or unattended.
Let's first review the differences between the older and newer versions. By older, I refer to Kdump setup as shown in my original guide, whereas by newer, I refer to Kdump as shown in the recent openSUSE and CentOS 5.4 tutorials.
Old (classic) invocation
The old invocation is done like this:
crash <System map> <vmlinux> vmcore
<System map> is the absolute path to the System map file, which is normally located under /boot. This file must match the version of the kernel used at the time of the crash.
The System map file is a symbol table used by the kernel. A symbol table is a look-up between symbol names and
their addresses in memory. A symbol name may be the name of a variable or the name of a function. The
System.map is required when the address of a symbol name is needed. It is especially useful for debugging
kernel panics and kernel oopses, which is what we need here.
For more details, you may want to read:
The Linux Kernel HOWTO - Systemmap
<vmlinux> is the uncompressed version of the kernel that was running when the memory core was collected.
vmcore is the memory core.
The System map and vmlinux files remain in the /boot directory and are not copied into the crash directory. However, they can be manually copied to other machines, allowing portable use of crash against memory cores collected on other systems and/or kernels.
New invocation
The newer versions of Kdump can work with compressed kernel images. Furthermore, they copy the System map file and the kernel image into the crash directory, making the use of crash utility somewhat simpler. Finally, there are two ways you can process the cores.
You can use the old way. Here's an example on CentOS 5.4:
crash \
/boot/System.map-2.6.18-164.10.1.el5 \
/boot/vmlinuz-2.6.18-164.10.1.el5 \
vmcore

Notice the use of vmlinuz kernel image, as opposed to vmlinux previously required.
Alternatively, you can use only the debug information under /usr/lib/debug. The information is extracted during the installation of kernel-debuginfo packages matching the kernel that was running at the time of the kernel crash.
The syntax for CentOS and openSUSE is somewhat different.
openSUSE:
crash \
/usr/lib/debug/boot/<kernel>.debug \
vmcore
CentOS (RedHat):
crash \
/usr/lib/debug/lib/modules/<kernel>/vmlinux \
vmcore

For more information, please consider reading the following articles:
Crashdump Debugging - openSUSE
I must emphasize that the topic of how gdb and crash find the debuginfo of binaries can be a little confusing, so you may also want to spend a week or three and read the long documentation on gdb:
Important details to pay attention to
Now, since SUSE and RedHat use somewhat different syntax, things can be a little confusing. Therefore, please note the following table of comparison:
openSUSE
System map is called System-map.
Debug info is located under /usr/lib/debug/boot.
CentOS (RedHat)
System map is called System.map.
Debug info is located under /usr/lib/debug/lib/modules.

Portable use
To process cores on other machines, you can either copy System map and the kernel or just the debug information file. Newer versions of Kdump and crash will work with compressed kernel images.
The debug info must match the kernel version exactly, otherwise you will get a CRC match error:
Running crash
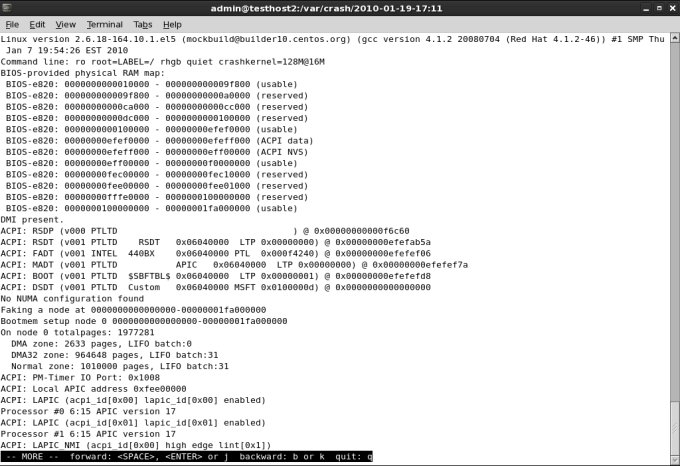
All right, now that we know the little nuances, let's run crash. Kdump is working and doing its magic in the background. We will not discuss Kdump-related issues here. Please refer to the three tutorials on this subject for more details.
If you get to crash prompt after invoking the crash command, either using the old or new syntax, then everything is ok.


Crash commands
Once crash is running and you're staring at the crash prompt, it's time to try some crash commands. In this tutorial, we will not focus too much on the commands or understanding their output. For now, it's a brief overview of what we need.
crash commands are listed in superb detail in the White Paper. In fact, the document is pretty much everything you will need to work with crash.
Here's a handful of important and useful commands you will need:
bt - backtrace
Display a kernel stack backtrace. If no arguments are given, the stack trace of the current context will be displayed.

log - dump system message buffer
This command dumps the kernel log_buf contents in chronological order.
ps - display process status information
This command displays process status for selected, or all, processes in the system. If no arguments are entered, the process data is displayed for all processes.

And there are many other commands. The true study begins here. We will review the usage of these commands, as well as many others in the upcoming sequel. There, we will examine several simulated, study cases, as well as real crashes on production systems.
Other useful commands
You will also want to try help and h (command line history).
Create crash analysis file
Processed command output can be sent to an external file. You merely need to use the redirection symbol (>) and specify a filename. This contrasts the usage of the lcrash utility, which specifically requires -w flag to write to files.
Crash running in unattended mode
Now that we know how to run crash commands and produce analysis files, why not do that entirely unattended? This can be done by specifying command line input from a file.
Commands can be sent to crash in two ways:
crash -i inputfile
Or using redirection:
crash < inputfile
In both cases, the crash inputfile is a text file with crash commands one per line. For the crash utility to exit, you will also need to include the exit command at the end. Something like:
bt
log
ps
exit
Thus, the complete, unattended analysis takes the form of:
crash <debuginfo> vmcore < inputfile > outputfile
Or perhaps:
crash <System map> <vmlinux> vmcore < inputfile > outputfile
So there we are! It's all good. But, you may encounter problems ...
Possible errors
No debugging data available
After running crash, you may see this error:


This means you're probably missing the debuginfo packages. You should start your package manager and double-check. If you remember, I've repeatedly stated that having the debuginfo packages installed is a prerequisite for using Kdump and crash correctly.

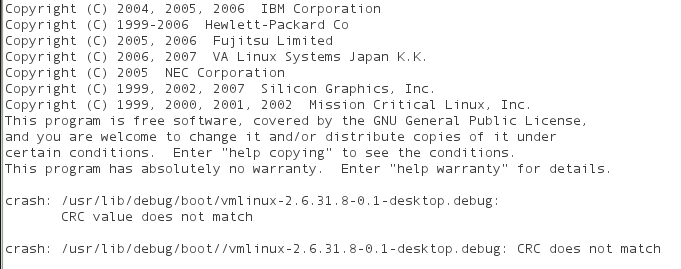
vmlinux and vmcore do not match (CRC does not match)
You may also get this error:

On SUSE, it may look like this:
If you see the following messages: vmlinux and vmcore do not match! or CRC does not match, this means you have invoked crash against the wrong version of debuginfo, which does not match the vmcore file. Remember, you must use the exact same version!
No guarantee
There could be additional problems. Your dump may be invalid or incomplete. The header may be corrupt. The dump file may be in an unknown format. And even if the vmcore has been processed, the information therein may be partial or missing.
For example, crash may not be able to find the task of the process causing the crash:

There's no guarantee it will all work. System crashes are quite violent and things might not go as smoothly as you may desire, especially if the crashes are caused by hardware problems.
For more details about possible errors, please consult the White Paper.
Crash analysis proper
We will do this in a separate tutorial, as this is a very long and complex topic. In the sequel, we will learn to interpret the meaning of the little bits and pieces in the crash analysis files.
Official documentation
Here's a selection of highly useful articles and tutorials:
White Paper: Red Hat Crash Utility (must read)
Crashdump Debugging - openSUSE
References
Furthermore, please refer to the following articles for more information:
Collecting and analyzing Linux kernel crashes - Kdump
How to enable Debug repository in CentOS Linux
CentOS 5.3 - Serious Linux for serious people
Conclusion
There you have it. Another super-geeky secret unveiled and simplified into human terms.
Hopefully, this article has taught you something new. We're one step close to mastering the secrets of the Linux kernel. We have a solid infrastructure in place. Kdump is running and we know how to use crash. This allows us to collect memory cores when our system crashes, analyze them and/or forward the information to vendors, helping them solve critical system bugs. We have not yet touched the analysis part, but we will do that soon.
Like I mentioned earlier, I have not compiled this into a PDF. I hope you will excuse me. If the popular demands gets big, then I will definitely consider and write down a nice shiny PDF.
Many more geek articles are on the way. Feel free to browse the Computers section. If you want to learn more about advanced system troubleshooting, you will definitely be interested in tools like strace, ltrace, oprofile, and others. We still have to talk about the omni-potent gdb and dabble in the black magic of the kernel debugger (kdb). But all in good time. Take care!
Cheers.
Appendix
lcrash utility (for LKCD)
lcrash is an older utility that you may want to use with memory cores collected using LKCD. In general, you will need not use the tool manually, because the lkcd save command that is invoked after the memory core is dumped invokes in turn lcrash and processes the core.
lcrash requires System map and Kerntypes files to process the cores:
lcrash <System map> <Kerntypes> <core>
<System map> is usually found under /boot.
<Kerntypes> is usually found under /boot. This file lists kernel structures and is required for the analysis of the cores.
<core> is the name of LKCD saved core. LKCD cores are named dump.X, where X is a sequential number, from 0 to 9. The cores are rotated after 10 collected dumps.
Kerntypes
If your running kernel does not have the Kerntypes file, you may be able to create one.
You will need to make sure your kernel has been compiled with the -g option. You can verify this under /proc/config.gz, CONFIG_DEBUG_INFO=y. We did mention this as a prerequisite for crash dump collection, by the way.
Next, you will require the dwarfextract utility and run it against the kernel that matches the one used to collect the core and extract the kernel structures. dwarfextract is a tool to postprocess debuginfo. The tools removes duplicate type information caused by linking different compilation units. Currently, the tool has only been used to work on the debuginfo of the kernel package. Further functionality has been requested in the future.

The usage is as follows:
dwarfextract vmlinux <Kerntypes>
You can name the file anything you want. Just make sure to use the correct name and path when you invoke the lcrash utility.
lcrash demonstration
And that's all. If your system is setup correctly, lcrash should load:

For more details, please consult the official documentation. You may also want to read the somewhat older howto on faqs.org. Furthermore, there's a very detailed guide in PDF format is available (direct link):
Other tools
gdb-kdump
gdb-kdump is a helper script that you can use instead of crash, although you will experience a limited subset of commands and functions. gdb-kdump can automatically search and processes the latest core, uncompress kernels, and run basic commands like bt, btpid and dmesg.
gdb-kdump is run against the vmcore file. By default, it will look for the same kernel used in the vmcore under /boot. If it does not find it, it will complain, but you can solve the problem by either copying or symlinking the vmlinux file.
gdb-kdump vmcore
Here's a sample output:

gdb-kdump usage is beyond the scope of this tutorial. We will talk more about gdb in a dedicated tutorial. Regarding Linux kernel crashes, we will mainly focus on the crash utility and its uses. Nevertheless, it is good to know about gdb-kdump; you may need or want it one day.
crosscrash
Another interesting tool you might be interested in is crosscrash. Like gdb-kdump, it's meant to facilitate the reading and analysis of memory core files, without forcing the users to remember the subtle differences between kernel releases, tools and formats.
crosscrash is still a new technology, so it may not work as expected. However, you should know about it and test once in a while, to see if it suits your needs.

That would be all.
Download
This tutorial is a part of my Linux Kernel Crash Book. The book is available for free download, in PDF format. Please check the book article for more details.
![]()