Updated: September 27, 2014
Here's a scenario. A Linux system is reported for being slow and not quite working as you would expect. A preliminary examination shows nothing out of ordinary. You do your due diligence, and run the routine bunch of commands, which only leads to a gentle shrug of gentle frustration. Nothing wrong seems to be afoot. Hmm, perhaps the memory usage seems to be a little high. But why? The plot thickens.
Today, you are going to learn how to cope with seemingly crazy problems that defy the simple mathematics and your logic as the system administrator, or perhaps, a highly enthusiastic user, keen on fixing a wonky box. After me.

Problem
Our problem, in more details. So Let's say you have this misbehaving Linux box that is churning memory and swap like a pro. Now, you find this highly suspicious, because the earlier, preliminary examination of the system memory usage revealed no reason as to why your box ought to behave the way it does. But let us be even more precise.
The system has 48GB RAM. If you consult top, it reveals a single heavy hitter with an 18GB real set, but other than that, there do not seem to be that many processes with high memory consumption, and the sum of all of the processes does not amount to what the total memory usage supposedly is. Looking at the system cache and buffers, again, the total is only 2.2GB.
00:14:08 up 9 days, 23:46, 26 users load average: 1.20, 3.87, 8.11
Tasks: 257 total, 1 running, 256 sleeping, 0 stopped, 0 zombie
CPU(s): 8.7%us, 0.7%sy, 0.0%ni, 89.7%id, 0.6%wa, 0.1%hi, 0.0%si
Mem: 48168M total, 48015M used, 152M free, 173M buffers
Swap: 99331M total, 10290M used, 89041M free, 2086M cached
PID USER PR NI VIRT RES SHR S %CPU %MEM TIME+ COMMAND
21992 root 16 0 24.2g 18g 5544 S 99 40.1 47012:06 java
19442 root 19 0 12.1g 277m 2076 S 5 0.6 22:36.92 java
31093 root 15 0 92960 77m 1864 S 0 0.2 2:38.63 perl
If you recall my older system hacking guides and howtos, then you will remember that Linux memory usage is a rough approximation. Commands like free and top will report nice sums, but they are not 100% accurate. For one thing, the free memory field is the most misleading one, because it may lead you to believe that the rest of the stuff is taken away. However, you also need to account the buffers and cached fields as free memory, since they are readily available to new processes. For instance:
free -m
total used free shared buffers cached
Mem: 129033 127434 1598 0 2240 103282
-/+ buffers/cache: 21911 107122
Swap: 131076 6 131070
Here, you may assume this 128GB system has only 1.6GB free. But this is not correct. More than 100GB virtual memory is safely cached. This means that that you should treat the system usage as:
Used = Total - Free - Buffers - Cached
In other words, if you want to know how much memory is free, you can safely add the cached and buffers values to the free count. Furthermore, for the most accurate count, you might want to sum the RES value for all processes in the process table. This can be done using the nice BSD notation, which gives you VSZ and RSS values:
ps aux | awk '{print $5}'
And then you can replace the newline character with a plus sign (using tr), and then pipe the numbers to a calculator to get the numbers you want. Of course, you can also always use the system reporting tools, like top and free and others.
Now, in our particular example, there's a problem. Namely, if we sum all of the memory usage in our system, the total amounts to about 22GB. This means we have roughly 26GB missing, according to what the top command reports. Well, minus the buffers and cached, but this still amounts to roughly 24GB seemingly unallocated for.
76+0+0+0+0+0+0+0+0+0+0+0+0+0+0+0+0+0+0+0+0+0+0+0+0+0+0+0+0+0+0+
0+0+0+0+0+0+0+0+0+0+0+0+0+0+0+0+0+0+0+0+0+0+2880+0+0+0+0+0+0+0+
0+0+0+0+0+0+0+6316+0+0+0+0+0+0+0+0+0+0+0+0+0+0+1936+0+332+5052+
2324+2732+1500+0+0+0+0+0+0+0+0+440+404+788+1180+484+436+464+420+
724+788+864+0+304+936+580+1680+936+608+0+0+0+0+0+0+0+0+0+0+0+0+
0+4668+5228+464+736+572+928+592+6592+2080+2688+1536+7972+1476+
5100+11160+2676+2676+2676+2676+2676+2676+2676+572+672+1516+6632+
1356+1512+1516+47696+20788+1512+6632+1512+6628+1512+25576+2676+
1512+6632+2676+2676+2676+2676+2676+2676+5740+2676+1560+1516+6564+
1512+1512+6576+6568+1512+6564+1516+6564+1512+6564+1516+6564+2644+
1508+1544+1112+916+576+0+1516+1848+1724+948+636+54100+624+616+
616+616+616+616+282868+5728+3528+1840+5720+4304+5408+6452+5412+
7244+808+1708+5256+635060+635060+635060+4132+2828+1444+4628+
2888+900+7288+1156+4052+2944+5508+5672+6892+2476+7124+4120+2716+
4540+2876+848+4612+2276+3408+5656+2048+7004+2476+1520+688+2344+
2676+7272+5072+6464+3944+2696+1512+54816+1476+5080+2668+776+
2472+19634496+4252+3964+2744+624+7280+4056+2384+640+460+820+
2312+5068+2840+1180+51808+836+644+12476+612+1476+1848+1424+1336+
4612+1420+4704+4220+2800+836+5512+1888+2676+4344+2300+856+832+
2944+1580+2636+2256+900+1512+52076+1476+5100
= 22.7GB
----------
So we are missing some memory. Where is it?
Slabinfo
At this point, we need to take a peek into the kernel space and try to figure out what gives. Luckily, you will not have to write your own kernel module. The /proc pseudo filesystem already provides a human-readable view into the kernel memory space via slabinfo. If you issue the cat command against /proc/slabinfo, you will dump the contents of this struct in a table displaying all sorts of useful data.
First, let us define this slab thingie. Quoting a bit from the encyclopedia material and such, slab allocation is a memory management mechanism intended for the efficient memory allocation of kernel objects which displays the desirable property of eliminating fragmentation caused by allocations and deallocations. The technique is used to retain allocated memory that contains a data object of a certain type for reuse upon subsequent allocations of objects of the same type.
Now, objects of the same type are organized into slab pools, which is the next hierarchy level in memory management. And slabinfo gives you information about memory usage on the slab level. Bingo. The output of the slabinfo is as follows:
slabinfo - version: 2.1
# name <active_objs> <num_objs> <objsize> ...
nfs_direct_cache 0 0 136
nfs_write_data 38 45 768
nfs_read_data 32 35 768
First, you get the slab name, the number of active and total number of objects of the particular type, the size of the object, and so forth. This is indeed what we are looking for. Multiply the number of objects with their size, sum across all the slab types, and you will get the total slab usage. In our case, can you guess what the total count will be? Yes, roughly 24GB, the missing memory. Bob's your uncle. Indeed.
slabinfo - version: 2.1
# name <active_objs> <num_objs> <objsize> <objperslab>
nfs_inode_cache 139446 241899 8456 1024
dentry_cache 202389 262029 7434 208
size-64 183017 212133 2335 64
size-128 334096 648180 128 30
buffer_head 154285 179652 88 44
blkdev_ioc 77103 77452 56 67
ext3_inode_cache 400597 402840 800 5
cfq_ioc_pool 77103 77326 168 23
radix_tree_node 190501 261128 536 7
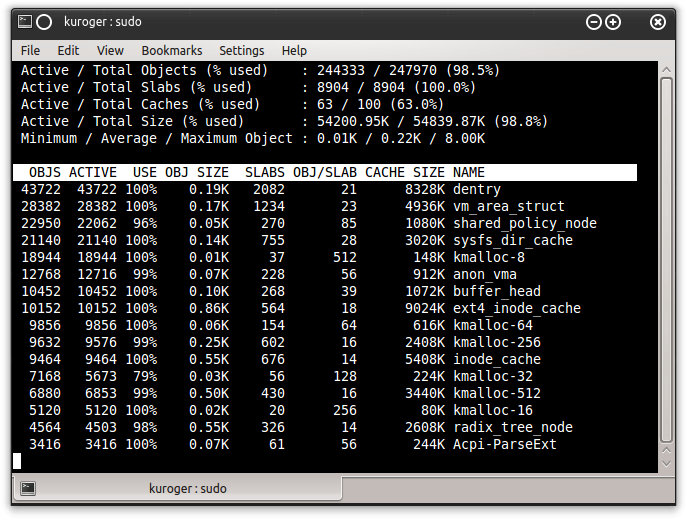
You can also use the slabtop command, which will parse the slabinfo and display a top-like view of the used slabs. This can be quite useful for problem debug in real time, plus it can save you time digging manually through the /proc/slabinfo data. Finally, if you consult /proc/meminfo, you will also get the total summary of the slab usage:
cat /proc/meminfo | grep -i slab
Slab: 9219804 kB
More reading
You should really invest some time reading all of these:
Linux commands & configurations
Linux hacking guides one two three and four
Linux system debugging super tutorial
Conclusion
You may ask, why did I not see slab info as cached or buffered objects? And that is a very good question, but it goes beyond your immediate problem, and that is figuring out how to account for all the system memory, regardless of the accounting methods used. Now, a much bigger challenge awaits you, and that is to sort out the program memory usage, understand if there might be a bug in the system memory reporting, and so forth.
However, for today's lesson, we have accomplished our mission. We wanted to know how to sort out the missing memory phenomenon, and we've done it. Living la vida kernel. While the black magic of the Linux memory management may never be fully unraveled, you have gained some valuable knowledge in this tutorial; how to use various system tools to check and interpret memory usage reports, and most importantly, check the kernel slab allocation. Your geekness level has just notched up, almost equaling your WoW skills. Peace.
Cheers.