Updated: March 25, 2009
A few days ago, I have reviewed Firefox 3.1 Beta 3. It's quite lovely. It boasts improved Javascript performance, it comes with new usability and privacy features, it supports future HTML multimedia elements ... But nowhere in that article did I mention the memory usage.

For a good reason.
Accurately measuring the memory usage of an application is a very tricky job. At best, you can have a guess, an estimate, an indication, but usually they are subjective and based on such a limited scope of factors that they are almost useless. Most people take the raw figures reported by various system utilities (like Task Manager, Process Explorer, ps) as the only arbitrator to memory usage demands.
In this article, I'm going to do two things: First, try to give you a straight, simple answer whether Firefox 3.1 Beta is going to use more/less memory than current Firefox releases. Second, I'm going to teach you a few pretty geeky things about memory management.
This article will mostly be about memory usage in Linux, because it is much easier to delve deep into the heart of things on this operating system, but I will not let Windows users hang in the dry either! We will go over the Windows Firefox memory usage, too.
Let us commence.
Why getting a simpler answer is difficult
This is because the operating system is a living thing with thousands of parameters changing every moment. It's like asking how much air a human breathes? It depends on a huge number of factors, including the processor type, clock and architecture, the operating system, the number of currently running processes, the priority of processes, the presence of system-polling software like integrity monitors, file checkers, anti-virus programs, and others, and many other things. Every computer user will report different results.
This means that my test here should be taken with a big pinch of salt. Most importantly, the absolute figures mean nothing. Secondly, you may experience a complete opposite of what I report here. At best, this review/tutorial is a good indication of what might be, with a pretty handsome error.
A real-life example
At one of my former workplaces, I was forced to run a McAfee anti-virus on my machine. This seemed to slow things quite a bit, including the responsiveness of Firefox, both on start and opening of every tab. When I turned the annoying anti-virus off, the response times shortened by at least two thirds, while memory usage dropped by half. It turned out the anti-virus was also trying to be a sort of a web content filter, so it was checking every single page I was trying to view. Anti-virus programs, firewalls, content checkers, web filters, toolbars, plugins, all these will make your browser behave differently.
Therefore, your tests (and mine) must be tightly controlled. If you wish to examine the behavior of an application, you will have to test its short and long-term usage, with single and multiple tabs open, when rendering images and running scripts versus static HTML text, when sitting idle for 12 hours versus cold start, when downloading etc. And do this at least twice for each version, to make sure the results reported are correct and gauge the variation.
I hope you understand the gravity of task at hand. Now, enough nonsense, let's get down to business.
Memory usage on Linux
Test case: Linux Mint 6 Felicia, running virtualized on an Intel Core Duo machine, with 512MB RAM allocated to the guest operating system, Firefox without any add-ons save the default theme. Let us first begin by examining what the system tells us by opening the System Monitor utility.
Firefox 3.0.3:

Firefox 3.1 Beta 3:

We can see that the Beta takes 29MB over 24.4MB used by the existing production version. This is on cold start, with a single tab open. Overall, it seems like a 19% increase.
What do these numbers tell us?
The answer is: nothing. On Linux, in general, applications tend to grab memory even if they do not intend to use them. This is particularly true for Java-based programs, which tend to pre-allocate memory for future use and then release it over time if it's asked for by other processes. So, the static figure means little. Taking more than you can use and then let go when someone else asks for it hardly constitutes as greed.
To see how much a program really takes, we need to take away all the excess. This means hogging the entire memory pool we have (512MB in our case). But this is difficult to achieve by just running tons of programs. In the worst case, if the system feels starved, its Out-of-Memory (OOM) kill routine will kick in and kill the most offending processes. Therefore, we need a short-term memory hog that will take everything and then give it back.
You guess right, we need a ... memhog.
Memhog
This is a very simple utility that does what we just described. Takes memory and then gives it back. In the process, it will force all running processes to give away their unused reserves, slimming them down to bare necessary.
Linux Mint does not have such a utility in its repository, but you can make your own. Download a piece of C code and compile it. Here's how you do it:
Once the little utility has been compiled, you run it thusly:
Example:

Let it run. It will take a few seconds, maybe a minute. Your system will not be very responsive in that period. Once it finishes, you can begin measuring memory usage of your test applications.
This means running the test program twice, once before memhog and once after. We will also use a more accurate way of checking system usage - the command-line ps utility.
Memory usage reported by ps (with memhog)
ps utility has many options and flags, allowing for a very thorough examination of used system resources. We will run it with aux flags and check the VSZ and RSS values. In the screenshots below, these will be the fifth and sixth columns in the output, respectively.
Explaining the fine details of what VSZ (Virtual Size) and RSS (Real Set Size) values mean is beyond the scope of this article, but I'll try to be brief: RSS is the actual footprint in physical memory and is contained in VSZ. VSZ is the virtual size of the process, namely code, data and stack. Even so, these two values do not count some parts of the process usage, including kernel stack, but since Firefox is a user-land program only, we should not worry too much about those.
We will mention VSZ and RSS a little more when we touch memory maps. For more about ps, please check the man page. So now, let's see what happens when we run Firefox, examine its usage, run memhog and then examine the usage again.
Firefox 3.0.3:

The two outputs refer to before and after running memhog. Overall footprint is 165MB, with real memory at 65MB on cold start. After memhog is run, the overall footprint remains almost the same, but the real memory drops to 16.5MB.
Firefox 3.1 Beta 3:
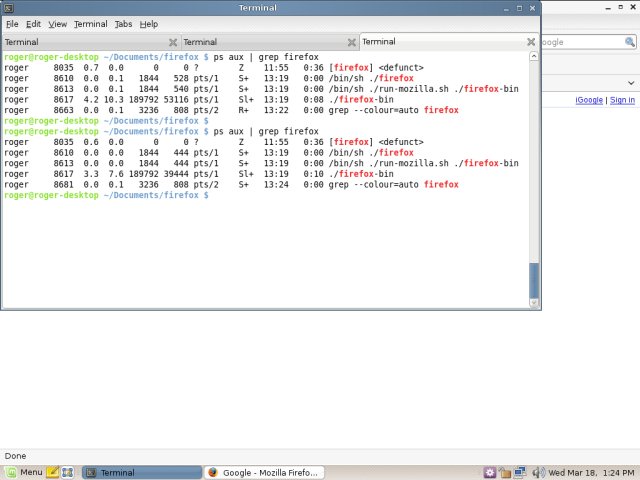
The VSZ value is 189MB, with real at 53MB before and 39MB after memhog is run. It seems that Firefox 3.1 Beta 3 pre-allocates less memory on start, which means it should be less of a memory hog [sic], but it does require a higher baseline to run.
This stands to reason, because Firefox 3.1 has MORE features than Firefox 3. And these have to be accounted for and accommodated somewhere. More features, more memory, but less greed.
If you look at CPU usage, Firefox 3.1 takes less than Firefox 3. 4.7% versus 7.7% before and 3.3% versus 4.2%, 27-64% improvement. This is also important, meaning Firefox 3.1 is lighter on the system and thus should respond faster, event though it takes a greater grasp on the actual memory. Now, let's take a look at the memory maps and try to figure out why Firefox 3.1 takes more.
Memory maps
Memory maps can be seen under the /proc pseudo-filesystem, for each process separately. First, you need to find out the process ID (we did this with ps), and then head to /proc/<pid>/maps.
Firefox 3.0.3:


I cannot explain the fine details of what maps report, but what you get, in the tiniest of tiny nutshells is this: The first few lines of this output are the binary code (text), data and heap segments. Then, we have the shared libraries the process uses. As we go through the output, we can study in details the memory usage of the application and try to understand its behavior.
For now, we'll do something much simpler. We're going to take a look at the overall number of maps the process takes. Take a look at the total count, 455.
Firefox 3.1 Beta 3:

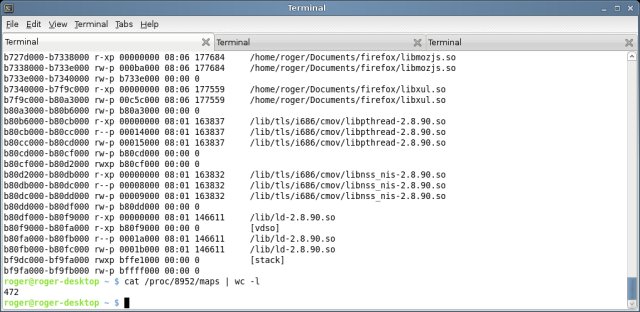
Here, we have 472. Stands to reason that Firefox 3.1 should need more, eh?
Memory usage under stress
But testing the program with a single tab open, doing nothing, is hardly a test. So I powered Youtube and checked how well the application handles Flash. Please note that the Flash Player is a third-party plugin for Firefox and that it comes bundled in Linux Mint. Therefore, I cannot 100% be sure my "stress" test means anything, but still, you may want to know. Do note that Firefox 3.1 has a much improved Javascript performance, as we've seen in the last article.
So here's what we have when Youtube is playing Jan Hammer, with ps reporting usage approx. every 5 seconds, in both browsers, on cold start, with memhog run just prior to the test.
Firefox 3.0.3:

Memory is steady at 163MB (40MB real) and CPU at 5.5%.
Firefox 3.1:

Memory is at 194MB (57MB real) and approx. 11% CPU. This means that memory wise, things are pretty much as they were before. The higher CPU utilization when running Youtube probably indicates the fact the Beta has not yet been optimized to make the best use of the Flash libraries. Which stands to reason, given the significantly revamped engine.
One more thing worth noting is that both memory and CPU usage do vary, depending on what is done on the system, making an exact verdict difficult, but I will try to rationalize all this super-geek stuff. Finally, let's take a look at the Out Of Memory (OOM) Score.
OOM Score
OOM Score is another number reported by kernel via the /proc filesystem. It tells the system the score of each process - and should a push come to a shove and the system runs out of memory - which process to kill. The lower the score, the better.
The exact mechanism how OOM score/kill works is not important. What we're looking for is the score comparison between the old and the new Firefox. The number can be extracted from /proc/<pid>/oom_score. I checked the figures before and after memhog.
Firefox 3.0.3:
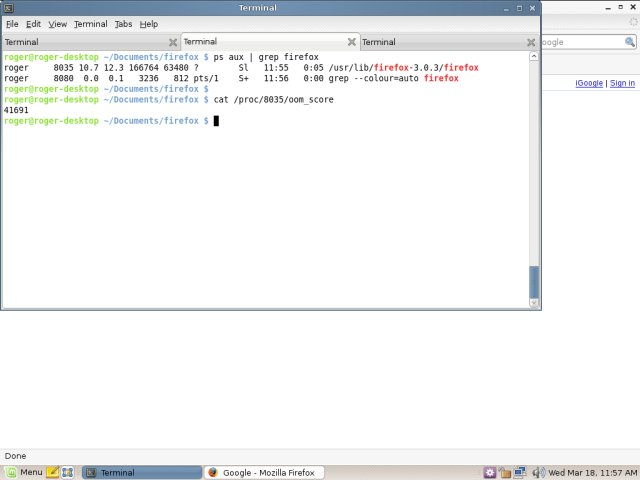

The difference is negligible before and after memhog is running, meaning Firefox uses memory rather smartly.
Firefox 3.1 Beta 3:
Here we can see the result after memhog is run (the first result is similar).

The difference between the two versions is minimal. Please note that OOM score is only meaningful by orders of magnitude rather than exact numbers. Therefore, the system treats both versions pretty much the same.
A mini conclusion so far: Firefox 3.1 does need more memory, because it's a bigger application, with more features. On the other hand, it uses less CPU when displaying HTML and Javascript, meaning you will most likely feel it is faster. Flash performance desires improvement, but this is something that both Adobe and the Mozilla team will have to work on together. It seems logical that I got these results, as the Flash Player is not intended for this Beta and came included with the distro (and the browser).
This pretty much concludes the Linux part. Now, we will check the Windows part.
Memory usage on Windows
Test case: Windows XP SP3, virtualized on an AMD Athlon 3700+, with 768MB RAM dedicated to the virtual machine, running Embedded theme and Firefox 3.0.7 without any extensions.
This section is going to be a little shorter as my Windows hacking skills, while decent, are somewhat less than on Linux. Besides, Windows people do not want to see too many command-line hacks, so I'll refrain from them.
I'll use two utilities to check the memory usage, the standard Task Manager and the Process Explorer utility, a powerful tool created by Sysinternals.
Task Manager
Firefox 3.0.7:

Firefox 3.1 Beta 3:
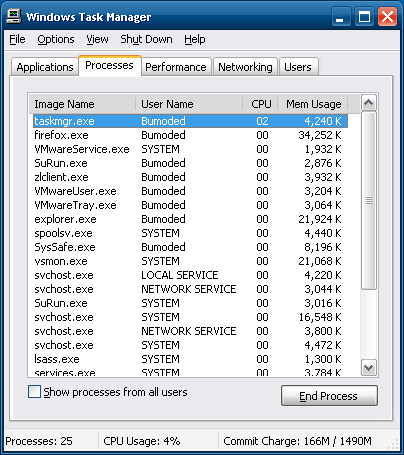
The memory usage is almost identical, with slight lead for the current version by 3MB. Overall, Firefox seems to use 31-34MB, with a single tab open. But we know this is not the whole story.
Process Explorer
We can also take a look at values similar to VSZ and RSS that we saw earlier for Linux. Process Explorer will gladly report these to you.
Firefox 3.0.7:

The important figures are the Working Set (54MB), Virtual Size (114MB) and Private Bytes (43MB). Private Bytes is what most users will want to refer to, the baseline the application must have to function properly. Working Set includes virtual pages the process maps. Virtual Size is the overall footprint the application has at the given moment.
Let's see what Firefox Beta reports.
Firefox 3.1 Beta 3:

Firefox 3.1 Beta 3 on Windows uses less memory. The baseline is lower at 25MB, the Working Set is at 34MB and the virtual size is 95MB. Approx., this is 20MB less overall. These results are different from what you get on Linux, which makes it all the more interesting.
Conclusion
On Linux, Firefox 3.1 Beta takes a little more memory, but less CPU than the current version, which means it should be snappier to respond. On Windows, Firefox 3.1 Beta takes approx. 20MB less than the current version - again, it should be faster.
But these figures, once again, mean nothing!
Windows and Linux have different ways of handling memory, with Linux usually pre-allocating more than needed and then releasing and Windows adding more memory by demand. This aligns well with the overall behavior of the two operating systems, where Linux usually wins when it comes to memory-intensive tasks.
Furthermore, we're talking two different operating systems, two different applications, essentially, so a direct comparison means little. In both cases, Firefox 3.1 Beta is expected to perform faster than the existing Firefox 3, given the working models of the two operating systems. Overall, the footprint differs only slightly, a few tens of MB, which probably won't change much in day to day use. However, you will feel a 30% increase in Javascript performance. Combined with lesser CPU utilization, you're about to enjoy a faster browser.
On Linux, Flash usage is currently under-optimized, though.
Please do not take these results as anything more than a rough estimate of what might be. The test is flawed and limited by design, even though I tried to be as thorough as possible. But the background noise and delicacy of the entire test make the results nothing more than a pleasant guess.
However, you did learn how to play with geeky stuff, like memhog, ps utility, maps, and whatnot, so the tutorial is not without added value. That's it for now, have fun!
Cheers.